Difference between revisions of "Architecture"
(→Capabilities) |
(→Capabilities) |
||
| Line 352: | Line 352: | ||
When talking about capabilities and gaps, we are in the '''World of Solutions'''. | When talking about capabilities and gaps, we are in the '''World of Solutions'''. | ||
| − | Capabilities are derived from the [[Architecture#Limitations]] by taking into consideration the vision, governance and principles layed down by the CIOs. | + | Capabilities are derived from the [[Architecture#Limitations|limitations]] by taking into consideration the vision, governance and principles layed down by the CIOs. |
Gaps result when future capabilities cannot be fulfilled with [[Architecture#current architecture|existing systems]] due to [[Architecture#limitations|limitations]] of the existing systems. | Gaps result when future capabilities cannot be fulfilled with [[Architecture#current architecture|existing systems]] due to [[Architecture#limitations|limitations]] of the existing systems. | ||
Revision as of 10:15, 15 February 2021
| under construction |
| this page is still under construction |
Contents
Current Architecture
In a first step existing systems and tools are analysed.
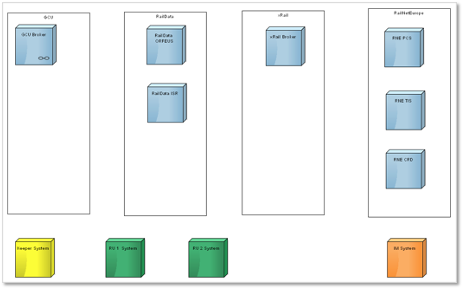
The topology shows the various systems and its current owners.
For those systems the business objects were determined and in a second step the workflows between the business objects.
All information is stored in Enterprise Architect in a common UML Model. A HTML copy of the model can be found here: UML Model
Topology
The topology shows currently existing systems and tools that are analysed in details. The following links guide you to the corresponding architecture models
The main systems are:
The topology can be found here: UML Model - Topology
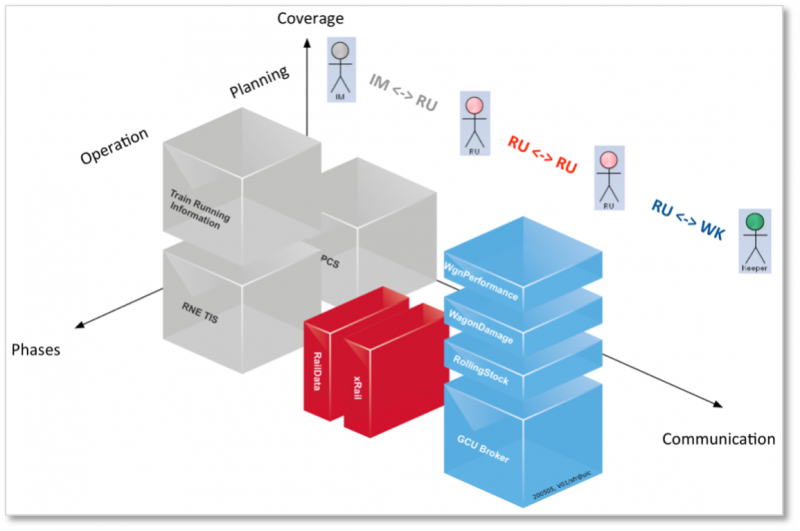
The following picture shows the platform coverage
Business Objects
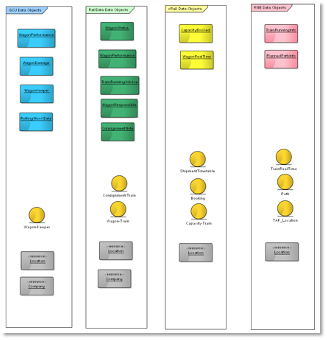
The business objects describe in an abstract way the basic objects of todays systems.
They are described in the UML Model for the above mentioned systems
The topology can be found here: UML Model - Business Objects
Detailed Business Objects are available for
Workflows
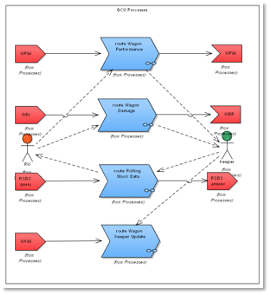
The workflows describe the interaction of the business objects of todays systems
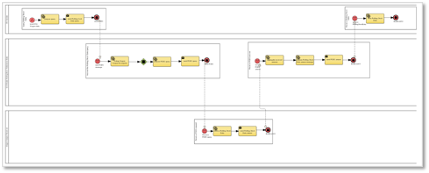
Each workflow is described with a swimlane diagram in details
Workflow diagrams and swimlanes can be found in the UML model for each of todays systems.
Please refer to the detailed diagrams in the subdirectories of the UML Model - Business Workflows.
Messages and Data Objects
An overview of all messages exchanged with the related data objects in the current architecture landscape can be found as a list in the following document in Teams: [Messages and Objects]
Refer to the sheet Messages.
Perspectives
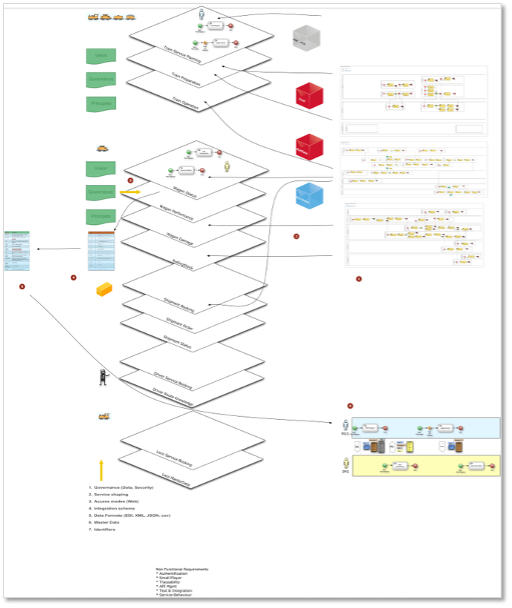
Based on the business objects and workflows of todays systems the services are extracted into abstract layers combining services from various systems.
Steps
The steps (see bullet points) for doing that are:
- Describe the processes and platforms (done in the current architecture)
- Remove platform borders keeping processes and objects
- Analysis of the services based on vision, governance and principles
- Aggregation of the found limitations
- Description of gaps (based on found limitations)
- Align services towards future architecture
Perspectives and links to Processes, Objects, Limitations and Capabilities
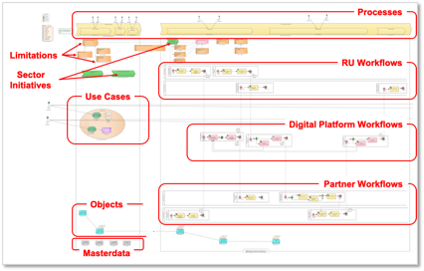
Each perspective is assigned to a process and contains the process steps taken out of one of the systems currently covering this perspective. In the UML model the perspectives are described in detail. The following picture shows what can be found for each perspective.
In the upper area of the perspective you find the Processes that are covered with this perspective. Below the Workflows for RUs and Partners as well as additional Digital Platform Workflows are described using swimlanes.
Use cases are described in the form of bubbles, showing involved actors.
Business Objects (blue) and Masterdata (grey) covered by this perspective are described in the lower area of the perspective.
Limitations found in the current perspective are positioned where they occur (activity, business object or below the processes for general limitations) and described with boxes (orange/brown).
Sector Initiatives belonging to this perspective that are not yet covered by a system or not yet described in the UML model are described with arrow-boxes (green).
Limitations are described in detail in a separate document. This document can be found here: [List of Limitations]
Todays Perspectives
The following perspectives were identified. The ones that contain a link are already defined and described in the UML Model.
- Train Service Planning
- Train Preparation
- Train Operation
- Wagon Status
- Wagon Performance
- Wagon Damage
- Wagon Check
- Order Consignment
- Braking Rules
- Rolling Stock Dataset
- Shipment Booking
- Shipment Status
Further possible Perspectives
Addtionally the following possible perspectives were identified. These perspectives may be analyzed in a later step.
- Transport Planning and Preparation
- Driver Service Book
- Driver Route Knowledge
- Locomotive Service Book
- Locomotive Master Data
The perspectives can be found in the UML Model
The list of limitations can be found here: [List of Limitations]
Non-Functional Requirements
Non-functional requirements describe additional requirements besides those derived from business objects and workflows
Basic Principles
The following basic principles can help to find non-functional requirements:
- Authentication and Security
- Small-Player Access to Services
- Traceability
- API Management
- Testing and Integration
- Service Behaviour
- Security and Redundancy
Non functional requirements were analysed together with the limitations and capabilities were defined, that on the one hand solve existing limitations but on the other hand also cover non-functional requirements.
A detailed description of the basic principles can be found here: [Basic Principles]
The list of non-functional requirements can be found here: [Non-functional Requirements]
Limitations
When talking about limitations, we are in the World of Problems.
Based on the description of the current systems with its business objects and workflows the limitations of todays systems can be analysed by making use of the perspectives.
Methodology
- Limitations are identified in workshops based on the perspectives
- Limitations found are documented in a spreadsheet and in the UML model
- in order to cluster the limitations
- duplicates are eliminated (in the spreadsheet)
- dependencies between limitations are documented in the UML model
- then the limitations are grouped into limitation groups in the UML model
- for each of the groups the benefits and impacts are defined
- all the groups are categorized in low, medium and high priorities
Criteria
The criteria to select potential limitations are:
- Constitutional Governance
- Data Governance
- Service Shaping
- Accessibility
- Integration
- Master Data
- Identifiers
Priorities
All limitations are analysed and priority for each limitation is set according the following criteria and scores
Priority Criteria
Problem Area (PA)
| If the limitation belongs to problem area | then the score is |
|---|---|
| Data Quality | 3 |
| Coverage (Governance) | 2 |
| Functionality / Business Processes | 1 |
Level (L)
| If the limitation belongs to level | then the score is |
|---|---|
| L1 | 3 |
| L2 | 2 |
| L3 | 1 |
Dependencies (D)
| If the limitation has the following dependencies | then the score is |
|---|---|
| other limitations are dependent on this (predecessor) | 3 |
| this limitation has no dependencies | 2 |
| this limitations depends on other limitations | 1 |
Value Added (V)
| If impact of the limitation is | then the score is |
|---|---|
| big | 3 |
| medium | 2 |
| small | 1 |
Effort (E)
| If the implementation effort of the limitation is | then the score is |
|---|---|
| small | 3 |
| medium | 2 |
| huge | 1 |
Weighting
For each of the above mentioned criteria a relative weight is defined
| Criteria | Weight |
|---|---|
| Problem Area (PA) | 3 |
| Level (L) | 1 |
| Dependencies (D) | 2 |
| Value Added (V) | 3 |
| Effort (E) | 2 |
Ranking
Based on sum of the scores of each criteria, multiplied with the weighting of the criteria an individual priority of each limitation results
Priority = (Score PA * Weight PA) + (Score L * Weight L) + (Score D * Weight D) + (Score V * Weight V) + (Score E * Weight E)
The priority of each limitation varies within the range of 1 and 10.
The higher the priority value the higher the ranking of a limitation.
SAFe Ranking
The limitations were ranked additionally according to the SAFe Methodology (Scaled Agile Framework) in order to analyse the limitations in a longer planning horizon and set priorities accordingly.
The lower the SAFe for a limitation, the higher is the priority to act.
SAFe = Score E / Score VA / Score PA
- the higher the effort, the higer the SAFe, meaning, the lower is the priority to act.
- the higher the value added and/or the problem are, the lower is the SAFe, meaning, the higher is the priority to act.
Conclusion
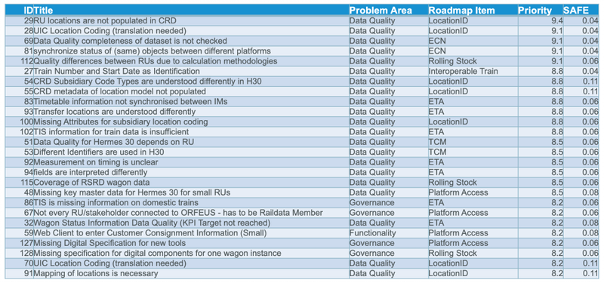
Based on the above described methodology the following 26 highly ranked limitations were found
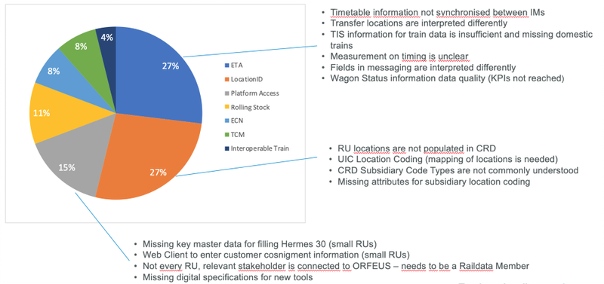
When looking at the coverage of the various clusters, the following picture shows up:
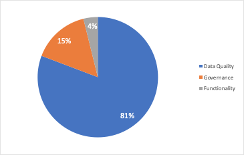
The first 19 of the top 26 limitations are related to Data Quality (out of 21 limitations), 4 limitations are related to governance and 1 limitation is related to functionality. Within the first 26 top ranked limitations business related limitations cannot be found.
Documents
A detailed description of the weighting criteria can be found here: [Criteria for Limitations]
The list of limitations can be found in the following spreadsheet: [List of Limitations]
An overview of all limitations can also be found in the [| UML Model]
Additionally you find the dependencies of limitations in the [| UML Model]
Capabilities
When talking about capabilities and gaps, we are in the World of Solutions.
Capabilities are derived from the limitations by taking into consideration the vision, governance and principles layed down by the CIOs.
Gaps result when future capabilities cannot be fulfilled with existing systems due to limitations of the existing systems.
They are the basis for the planning of development initiatives.
Methodology
Based of the priorised groups of limitations the capabilities are elaborated:
- Definition of the capabilitity targets (what do we want)
- out of the limitations
- from platform requirements
- from the vision
- Link the capabilities with the groups of limitations
- Elaborate the gaps between the groups of limitations and the expected capabilities
- Work out solution variants for the gaps, clearly describing
- functionality
- implementation effort (T-Shirt size, XS-S-M-L-XL)
- implementation duration
- affected stakeholders
- Assess the solution variants
- Decide about the final solution variants to be implemented
The result of this work is a backlog of solutions, that can be implemented in the World of Implementation.
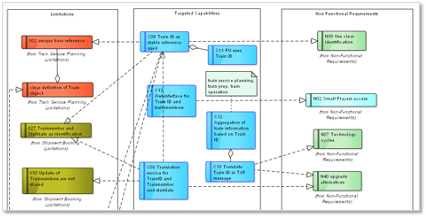
The capabilities can be found in the UML Model.
Figure - Capabilities
They are linked with the limitations and non functional requirements.
Details can either be found directly in the Capability object or in the capabilities sheet here.
Capabilities Overview
The following areas were considered when looking for future capabilities. The links refer to the UML model, where you find the details for the capabilities of the corresponding area.
- Location Identification
- Train Identification
- Train Operations
- Wagon Status
- Wagon Damage
- Wagon Performance
- Rolling Stock
- Train Preparation
- Braking Rules
- Shipment Booking
- Shipment Order
- Train Service Planning
- Intermodal Traffic
Weighting and Ranking
All capabilities found were evaluated and a weighting added to each of the capabilities. The following approach was used to rank the capabilities:
Select Capabilities Along Limitation Ranking
- All limitations with a priority higher than 8 were selected, which results in 26 limitations
- All capabilities that solve these limitations were selected and the priority of the capability was set to the priority of the limitation with the highest priority
This results in 22 capabilities
Independent Evaluation of all Capabilities
All capabilities were evaluated independently as follows
estimated the cost of each capability
(3=low/<200k€, 2=medium/200k€-1M€, 1=high/>1M€)estimated the benefit of each capability
(3=high, 2=medium, 1=low)calculated the SAFE-factor for each capability
SAFE = 1/cost/benefit (SAFE varies between 0.11 and 1)excluded the capabilities already ranked along limitation ranking
sorted remaining capabilities according to ascending SAFE
selected capabilities with a SAFE-factor = 0.11
This results in 14 capabilites
Additional Capabilities
At the end additional capabilities were selected that have a link to one of the above selected capabilities, since these capabilities have to realized together with the already selected capabilities in order to achieve the expected result.
This results in 18 additional capabilities.
The 54 selected capabilities (of 105, 51%) solve at least 75 limitations (of 201, 37%)
Conclusion
The 54 capabilities found cover almost all clusters
Figure 14 - Capabilities by Clusters
Within these 54 capabilites, only capabilites for Braking Rules do not appear. Their ranking is too low to appear in the list of ranked capabilities.
When clustering the 36 main capabilities (without the related ones), the following situation shows up
Figure 15 - Capabilities Overview
In the overview document of all capabilities (here), an even more detailed view of the capabilities and the covered limitations can be found.
Ein Bild, das Tisch enthält. Automatisch generierte Beschreibung
Figure 16 - Extract of Capability Ranking
The list of capabilities can be found here: List of Capabilities (as part of the List of Limitations). Each limitation described in this document has a link into the UML model.
Capabilities can also be found in the UML Model directly: here
